How far can you see from the Empire State Building ?
(Ref 1) : "In central Manhattan, New York City, on Fifth Ave. between 33d St. and 34th St. It was designed by the firm of Shreve, Lamb, and Harmon and built in 1930ÅE1. For many years its 102 stories (1,250 ft/381 m high) made it the tallest building in the world. The construction of the World Trade Center ended its reign as the world's and the city's highest skyscraper, but it regained the latter distinction through misfortune when the Trade Center was destroyed (2001) by a terrorist attack. An office building, the Empire State Building accommodates some 25,000 tenants. On a very clear day the view from its highest observation tower embraces an area with a circumference of nearly 200 mi (320 km)."The question is How good is the number like "a circumference of nearly 200 mi (320 km)" ?
This means that if a circle is used to indicate the range of visibility from the observation floor of the Empire State building, the radius of a circle centered at New York city is around 32 mi (51 km).
(use the formula : radius = circumference/(2 * 3.1416) )
It is not clear from this article how the author got this number, so let us find out the answer.
Mathematical Background
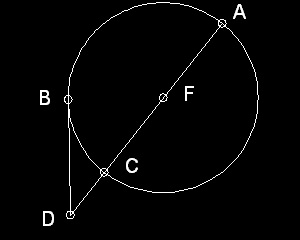
In order to get the answer, the following theorem known as Proposition 36 in Book III of Euclid's "Elements" will be used.In the drawing below, point F is the center of the circle, line segment AC is the diameter of the circle, point D is a point in line with AC, line DB is a line from point D and touching (tangent to) this circle at B. Then the following relation is true.
DB x DB = DC x DA
**********prop_36.dwg**********
Let us apply this theorem to the case considered here.
AC = 2R : diameter of the Earth( 6378 km or 3964 miles)
DC = h : Height of the observation floor from the surface of the Earth(381m or 0.381 km or 1250 ft)
DB = L : Distance to the farthest visible horizon
Then L2 = h (h + 2R) ----> L = e(h (h + 2R)) --------------------(1)
This can also be written as L = e(2hR (1 + h/2R)) -------------------(2)
Substituting actual numbers for R & h in formula (2), the result is
L = e(2*0.381*6378(1 + 0.00005974)) = 69.715 km -------------------(3)
Looking at (2) and (3), it is clear that the value of (h/2R) is negligibly small as compared with 1.0
Then the distance L can also be written as L = e(2hR) -----------------(4)
It is convenient to express the distance (L) in (miles/kilometers) , the height (h) in (feet/meters)
Then the following formula can be used as good approximations.
In Metric system--- L = e(2Rh/1000) = e(12.756h) = 3.572*e(h) ----(5)
In feet/lbs system--- L = e(2Rh/5280) = e(1.5015h) = 1.225*e(h) ----(6)
In the example shown here, formula (5) gives L = 69.72, which is a very good approximation.
Result shown on the map
Using the Raster image import feature of CAD, a New York Vicinity map is displayed, and two circles with radii 50 & 100 kilometers centered at New York city center are added to the map to show how far it is possible to see the hypothetical horizon from the Empire State Building Observation floor. This map has a scale bar for 100 kilometers, so that scale bar is used as a radius and diameter for two circles, and the centers of these 2 circles are moved to the point where New York City is.
**********New_York_vicinity.dwg**********
CAD operation
In order to get this data using CAD,the following steps are needed.
(1)----draw a circle with the Earth's radius.
(2)----draw a line connecting the diameter vertically, and extend the line 1 kilometer upward.
(3)----Split into 3 view ports,two horizontal views first, then the lower view port split into 2 ports.
(4)----Draw a (red) line representing the building.
(5)----From the top of the red line, draw a line tangent to the circle(blue).
(6)----Use list command to find out the length of the line drawn in step (5)
The result will look like this.
*************************view_range.dwg*************************
To create this drawing semi-automatically:
Load earth_model.lsp (load "earth_model")
Then from command line, type view_range
All the steps up to (4) are done by this command
After 3 view ports appear, a line will be drawn from the top of the line representing a viewer tangent to a circle. To repeat the process for a different height, the previous tangent line must be erased, and a new command (height_input) must be typed in the command line window. The exact value for "L" using formula (2) is shown in the text window. The numerical values for height(h) and range(L) in the drawing below are displayed using DIMENSION menus.
References
- http://education.yahoo.com/reference/encyclopedia/entry?id=15459 ,a short description on the Empire State Building.
- Translated by Heath, Sir L.H.: Euclid's "ELEMENTS". Originally published in 1908
Go to Fun_Math Content Table Earth Moon & Sun
All comments should be sent to Takaya Iwamoto
Copyright 2006 Takaya Iwamoto All rights reserved.