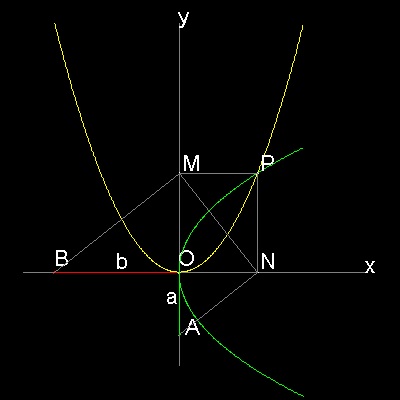
The basic concept of Menaechmus's method is to rotate three similar right triangles around one point "O" clockwise starting from BO.(See the #3 case of Menaechmus below).
There are multiple ways to accomplish this motion by mechanical constructions.
One way is as follows:
ANM is a rigid bar with angle ANM set to 90 degrees.
Bar BM moves in such a way that it always stays perpendicular to MN.
Restrictions: BM passes through point B, and AN passes through point A.
********** Menaechmus_Delian_3.dwg *********
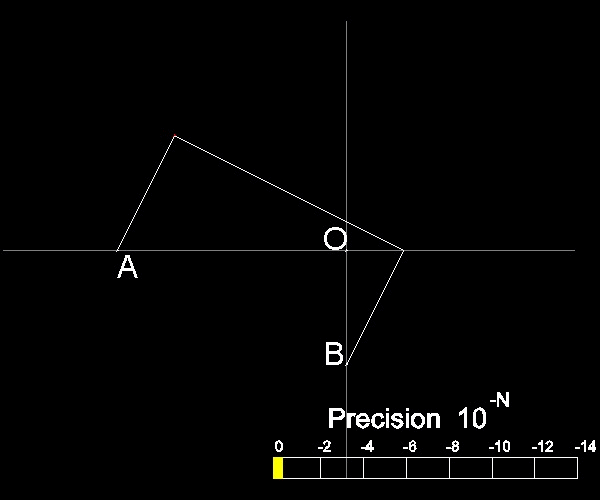
A sample is shown in the next figure.
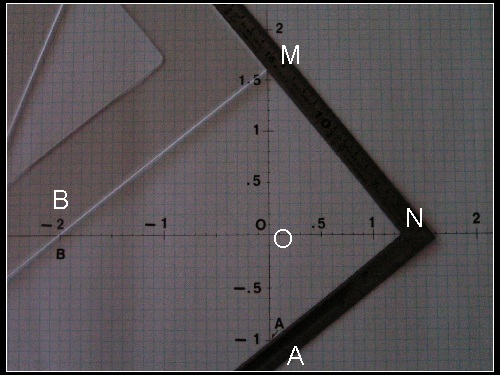
********** Plato_Delian_tool.dwg *********
A (Japanese) carpenter's square is used as a rigid 90 degrees tool, and a drafting
triangle is used to slide along this square.
For reference, exact solutions are
ON = (2)1/3 = 1.2599.. , and OM = (2)2/3 = 1.5874..
In the figure, ON =1.25, and OM = 1.55 ~ 1.6
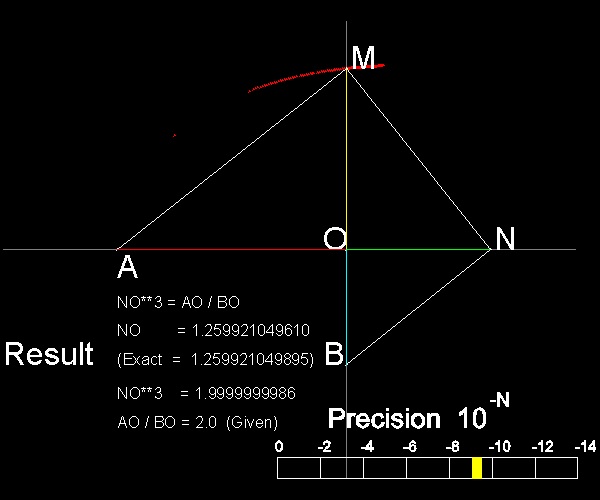
********** Plato_Delian_result.dwg *********
You can see the process in animation
To create this drawing and animation:
Load Plato.lsp (load "Plato")
Then from command line, type Plato_Delian
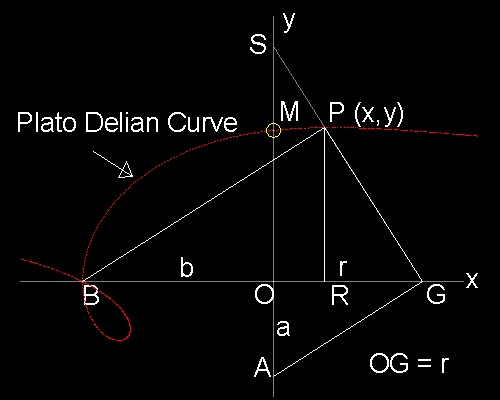
********** Plato_Delian_curve.dwg *********
 BPGA is the Plato's apparatus. G is on x-axis, but P is not on y-axis.
 PR is drawn perpendicular to x-axis, and extend GP to meet y-axis at S.

 In the drawing, AO = a, BO = b, PR = y, OR = x, and OG = r

 In the right trianlge BGP,
	BR.RG = PR2
or	(b+x)(r-x) = y2                         (1)

 Since trianlgle SOG and PRG are similar,
	PR:RG = SO:OG = OG:OA
or	y/(r-x) = r /a					   (2)
 Eliminating r from (1) & (2),
 we obtain,as the locus of point P (x,y), the following equation of curve.

	a(b+x)2 = y(x2 + y2 + bx)  (3)

This is a curve of cubic terms in y, and shown in red dot in the drawing.
A very interesting shape !

 The solution point (M) is the intersection of this curve and y-axis.
 It is given by letting x = 0.
 Therefore
	y3 = OM3 = ab2

Note here that if we choose line BPG as a rigid frame and try to find point G
,then the equation will be obtained by changing a to b, x to y in (3) .
        b(a+y)2 = x(x2 + y2 + ay)

The intersection is obtained by letting y = 0.
or 	ba2 = x3 = ON3
|
To create this drawing :
Load Plato.lsp (load "Plato")
Then from command line, type test_2 for plotting red points.
All questions/suggestions should be sent to Takaya Iwamoto
Last Updated Nov 22, 2006
Copyright 2006 Takaya Iwamoto All rights reserved.